Teaching
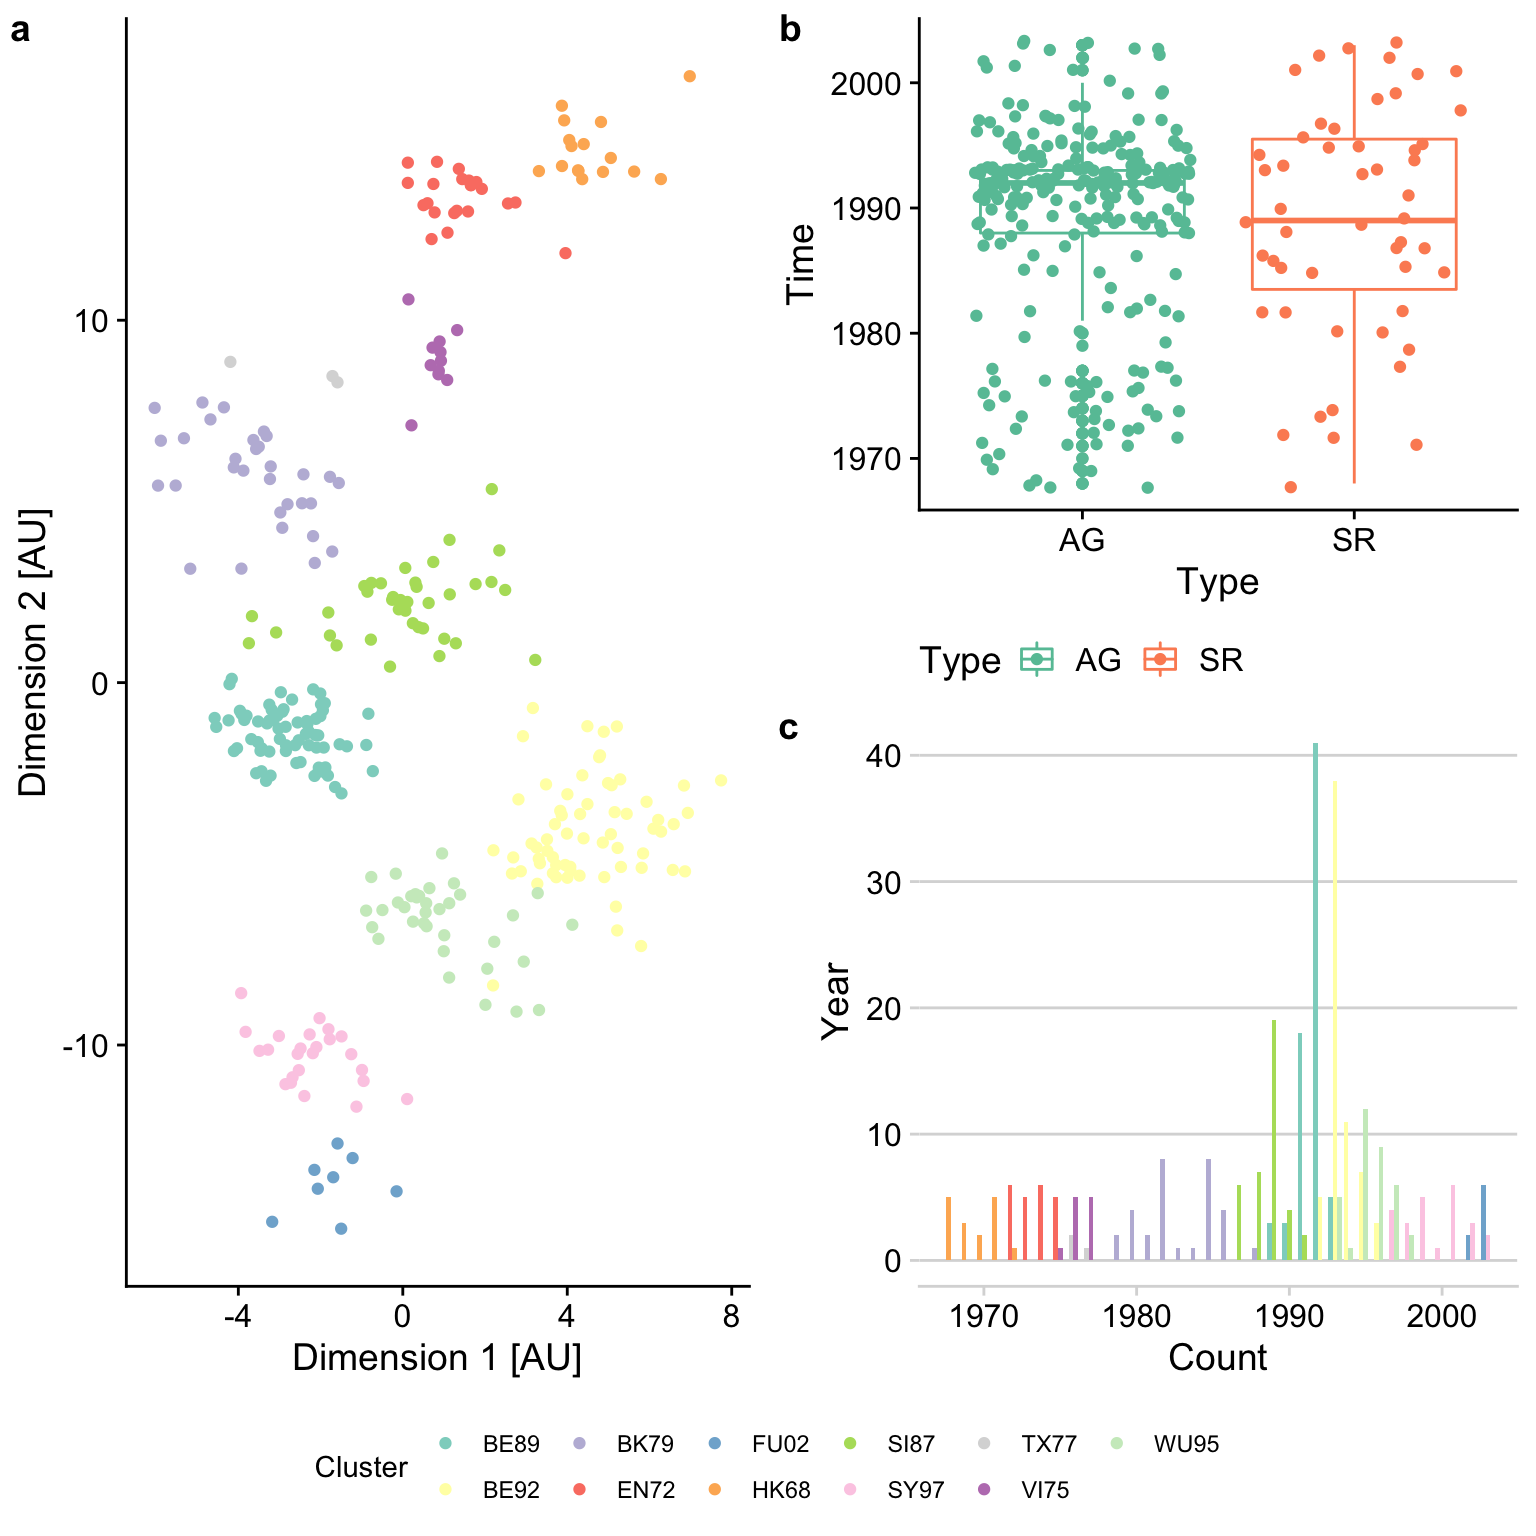
R data visualisation course
Beginner's course for data visualisation and analysis in R.
It covers setting up R/RStudio, the basics of data visualisation and compound figure
design as well as data transformation using the R tidyverse - all by
using a publically available dataset on antigenic cartogaphy of
influenza viruses.
It is especially designed for people with no prior coding experience.
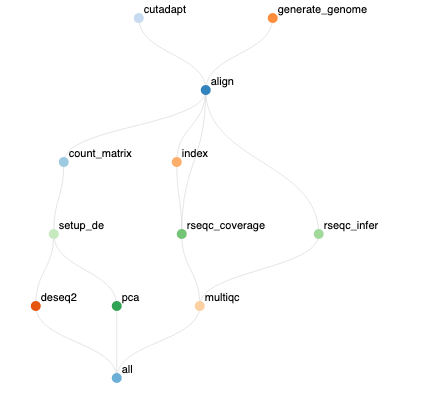
Introduction to RNAseq analysis using Snakemake.
Course for buildung an RNAseq analysis pipeline using the
workflow managment system snakemake. The pipeline includes
alignment, quality control and differential expression analysis.
The course also contains a homework assignment to test the new
concepts. The final pipeline and assignment results can be found
here.